


 5 / 256

5
CORPORATE GOVERNANCE
FINANCIAL INFORMATION AND
RISK MANAGEMENT
ACTIVITIES
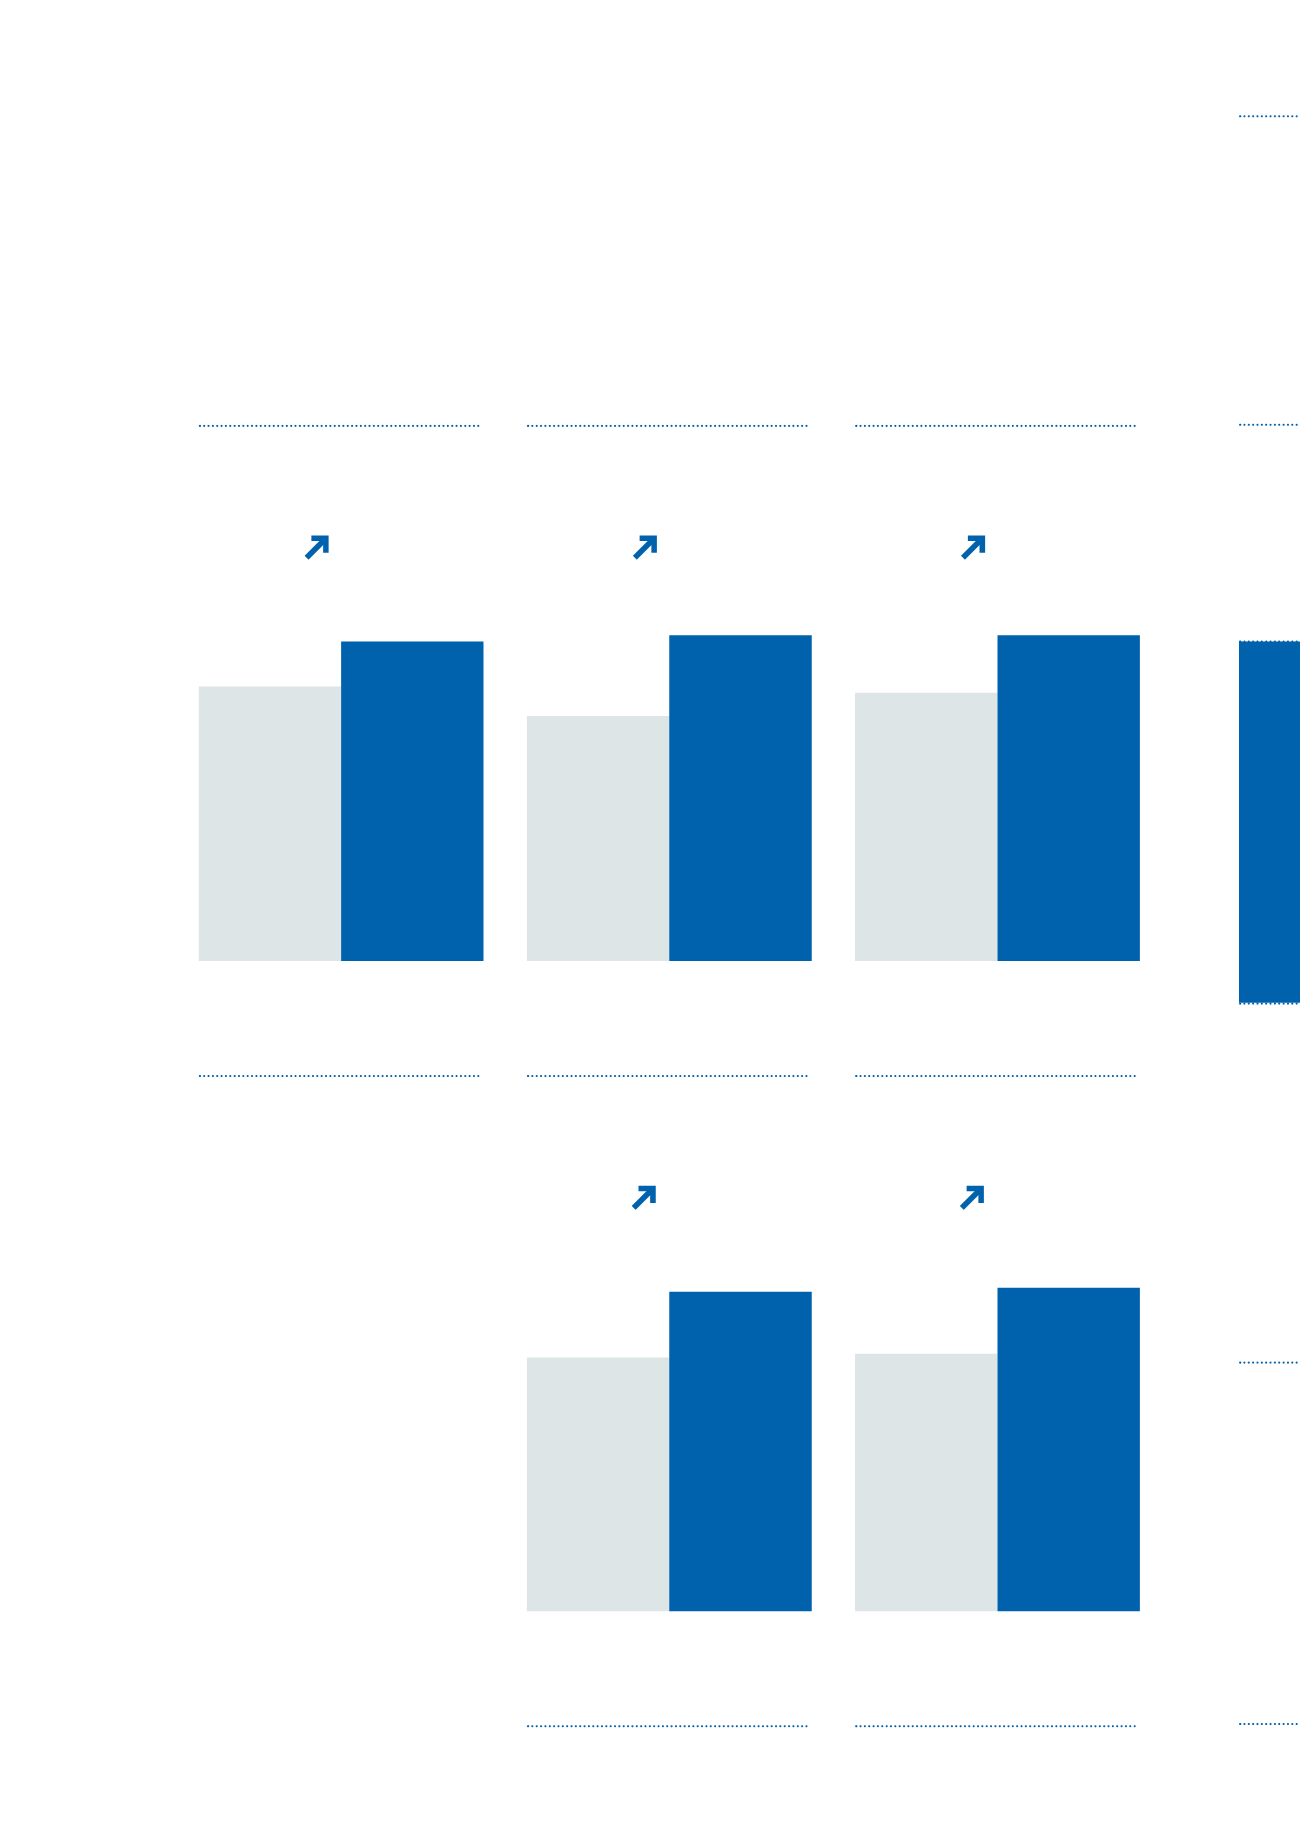
Shareholders’ Equity
(TL billion)
Loans
(TL billion)
Total Assets
(TL billion)
Net Profit
(TL million)
Deposits
(TL billion)
2009
2009
2010
2010
2.372
2.982
13.5
17.0
2009
2009
2009
2010
2010
2010
72.2
88.3
48.3
64.2
113.2
131.8
26.1%
25.7%
16.4%
32.9%
22.3%